We don't just talk about our performance. We prove it to you.We aim higher than just resetting the standards within the forex industry – we also deliver the highest levels of transparency to all our clients. The statistics below show exactly why we're so proud of our trading conditions, which include some of the best spreads in the business.
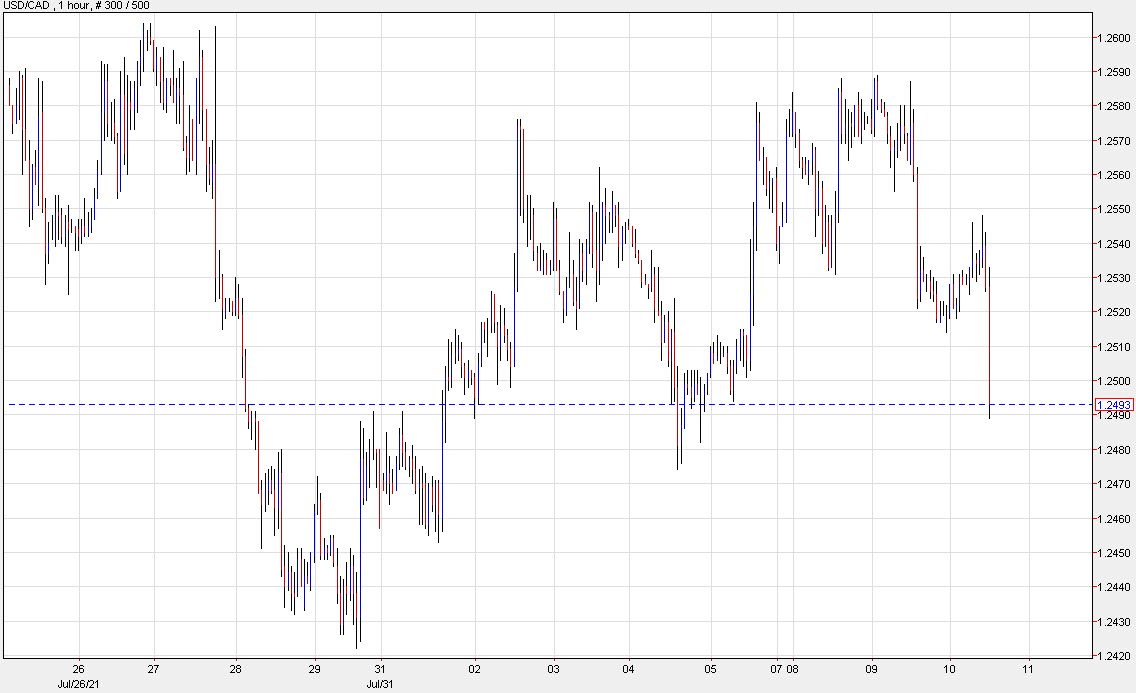
The inflation debate is raging in financial markets and we can see just how sensitive price action is after today’s US CPI data. The numbers were generally in line with forecasts and yet the dollar is down sharply across the board.
One example is USD/CAD, which is down nearly 40 pips and through 1.25 to the lowest in four days.
I’m surprised by the size of these moves but it speaks to the taper debate (Sept vs Dec) along with the pace of the taper once it starts. Ultimately though, it relates back to interest rates and if inflation comes down on its own, then there’s no need for the Fed to ever get above something like 1% on fed funds.
What’s interesting to me here is how substantial this move has been on an ‘in line’ print on CPI. That suggests that dollar longs are crowded, something Goldman Sachs recently warned about.
Forex news for North American trading on August 6, 2021
The awaited jobs report was released today at 8:30 AM ET, and it did not disappoint. The net change in nonfarm payroll jobs was 943K. That was above the 870K estimate. Moreover, the June report was revised higher by 88K to 938K, and the May report was also revised higher by 31K to 614K (from 583K).
Overall, with revisions, the US added 1.062M jobs which is good news for the economy.
Making the report even more impressive was that the unemployment rate tumbled to 5.4% from 5.9% last month. The underemployment rate fell to 9.2% from 9.8%. Hourly earnings rose by 0.4%, and the year on year measure is now up 4.0% year on year versus 3.9% estimate (and 3.4% last month).
Leisure and hospitality led with a gains with 380K jobs added.
Government added 240K
Professional business services, +60K
education and health services, +87K
transportation and warehousing, +49.7K
The one cautionary tone is that the local government education category (part of Government) is out of sync with the seasonal adjustments due to Covid. It showed a oversized 220K increase in jobs and may have a “give back” in coming months. Nevertheless, the report was still very solid.
As a result, traders will now be looking for Fed comments as the market prepares for a taper that may/should be sooner than expected.
Fed’s Clarida said this week that he could see a December taper . Fed’s Wallers, Bullard and Kaplan would rather start the taper sooner rather than later so the Fed could have flexibility to tighten interest rates in 2022 if needed. Next week, the market will hear from Fed’s Bostic, Evans, George and Barkin are all expected to speak next week. I would imagine, it will be hard to keep Fed’s Bullard from an interview at some point (he is not shy especially if he is right and he has been one of the more hawkish Fed officials and will be voting in 2022).
Goldman Sachs increased their chances for a November taper to 25% and December 55%. The Fed Chairs Jackson Hole speech (the event takes place from August 26 to August 28) becomes days to circle on the calendar for taper clues.
The reaction in the markets saw:
The USD move higher
Flow in stocks into the Dow cyclicals and out of technology (i.e. Nasdaq)
Higher US rates
Lower gold.
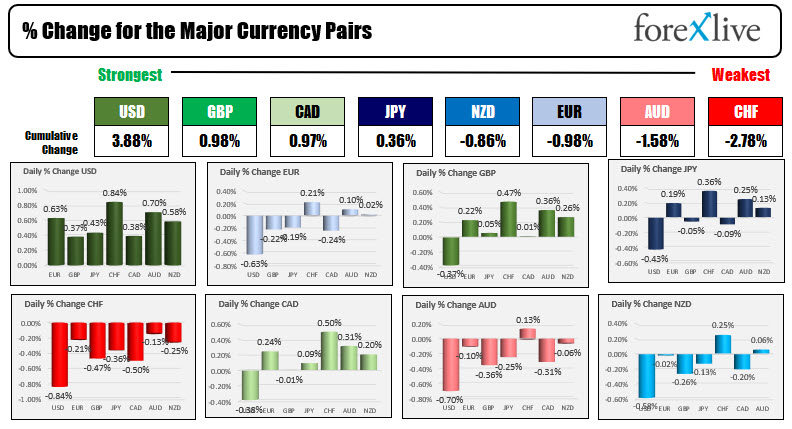
Looking the strongest to weakest in the forex market, the USD is ending the day as the run-away strongest of the major currencies. The CHF and the AUD were the weakest.
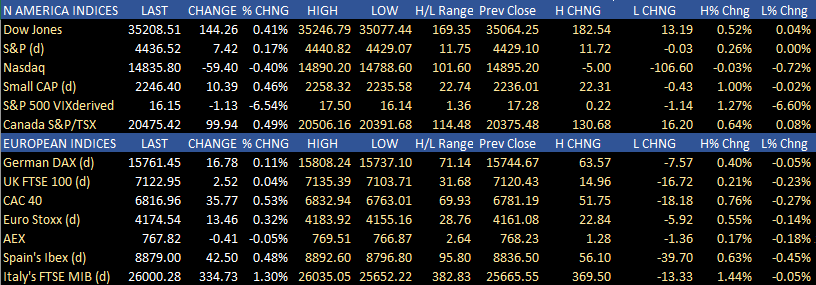
In the US stocks, the Dow and S&P indices both closed at record levels with the Dow leading with a gain of 0.41%. Leading the charge today were financials which rose 2.01%. Materials (+1.47%) and Energy (+0.94%) were also winners today. Discretionary (-0.73%), real estate (-0.25%) and technology (-0.12%) were the laggards.
The Nasdaq index light with a -0.4% decline after closing at a record level on Thursday. Despite the decline today, the NASDAQ index led the way with a 1.0% gain for the week.
In the European market today, the major indices all closed higher but off their highs levels. The France’s CAC rose by 0.53% and closed at its highest level since 2000. It is only 100 points or so from its all-time record high.
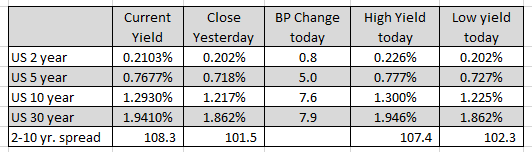
In the US debt market, yields this week trade as low as 1.127% in the benchmark 10 year yield. The yield is going out the week at 1.293% up nearly 16 basic point from the weeks low. Next week will be a key test for the global demand of US debt, as the U.S. Treasury will auction off:
$58 billion of 3 year notes on Tuesday,
$41 billion of 10 year notes on Wednesday, and
$27 billion of 30 year bonds on Thursday.
In other markets today:
Spot Gold tumbled $41.50 or -2.3% to $1762.76
Spot Silver fell $0.83 or -3.33% to $24.29
WTI crude oil futures felt $-1.14 or -1.66% at $67.97. For the week, crude oil fell over 7% from Friday’s closing levels
The price of bitcoin rose $1838 to $42,733.48. The price is trading at the highest level since May 19, 2021. The 200 day moving average going into the weekend is currently at $44,822. Will traders squeeze the price toward that key MA level? I would not be surprised.
Wishing you all a great and healthy weekend. Thank you for your support this week.
Understanding The Pin Bar Candlestick Pattern: In today’s article, we’re going to be taking a look one of the most common candlestick patterns you’ll see form in the forex market. Yes, of course I’m talking about pin bars (or hammer candlesticks as they’re often called). The pin bar candlestick reversal pattern can be found forming all over your charts. They appear frequently, and are one of the most popular price action patterns traders watch out for in the market, mainly due to how simple they are to identify and trade. Forex Candlestick Patterns
Candlestick Patterns
Forex Candlestick PatternsPin Bar Candlestick Pattern
Understanding The Pin Bar Candlestick Pattern
This article is going to be a general overview of all things pin bars. I’m going to teach what they are, why they form in the market and how to identify them on your charts. At the end of the article I’ve put some links to other pin bar related articles on my site, so if you already have a basic knowledge of trading pin bars I’d suggest skipping to the end to look at some of my other articles.
What Are Pin Bars ? I think the best way to start this article is by giving you a little bit of background as to what pin bars are, because it’s important to understand the basics before we move on to some of the more advanced stuff as it will only make things more difficult.
To put it simply, a pin bar (or hammer Candlestick as it’s often called in older trading literature) is price action pattern which is supposed to be a signal a reversal may be about to take place in the market. The reason I say supposed, is because not all pin bars are sign the market might be about to reverse. Some are, but the vast majority have actually formed as a result of the bank traders taking profits off their trades, not because they were placing trades to make the market reverse, which is what most price action books/websites assume is the reason behind every pin bar forming in the market. Trading the pin bars which have been created by the banks taking profits often results in losing trades, due to the fact once the banks have finished taking profits off their trades they’ll want the market to continue moving in the direction to which their trade have been placed, which means the market will move back in the direction it was moving in before the pin bar formed in the market.
Understanding what causes pin bars to form in the market is necessary to becoming successful trading pins, but it’s not something I’m going to show you how to do in this article, as it requires you to have a deep knowledge of high level market mechanics, like how buy and sell orders enter the market and how these orders are used by the bank traders to place trades and take profits. It would take me a huge amount of time to explain these concepts to a beginning trader (which is kind of the trader this article is primarily aimed at), so if you want to learn more about how and why pin bars form in the market, I’d suggest taking a look at some of the other articles I have on my site about pin bars and how the bank traders trade the forex market, as these will increase your understanding to a point where you should be able to identify which pin bars have formed from the banks taking profits off their trades and which have formed from them placing trades to make the market reverse.
If you don’t have the time to learn how to do this from the many articles I have available on the site, you can just purchase my Pin Bars Uncovered book from the Cool Stuff page and get a straight forward guide on the different types of pin bar that form in the market and step by step instructions on how to trade each type of pin. It’s not necessary, but it will greatly reduce the amount of time it takes you to understand the things which will make you more successful trading pin bars, so if you’re interested in that check out the Cool Stuff page.
How To Identify A Pin Bar With that out the way the next thing to do is to show you what pin bars look like, so you can begin identifying them on your charts and gaining some much needed experience in understanding how they’re constructed.
The great thing about pin bars (and the reason I believe there so popular with price action traders) is they’re really easy to spot on your charts. With other price action patterns, like the head and shoulders pattern or the flag pattern, the patterns themselves often only become obvious once someone has pointed them out to you. With the pin bar, you can easily spot when they have formed on your own and there can be no confusion as whether the candle your looking at is a pin bar or a different type of candlestick.
Lets now take a look at what pin bars are supposed to look like when they form on your charts.
image of bearish pin bar 1
The image above is an example of a bearish pin bar.
Notice how the body of the candle (the red bit for those who don’t know) is found at the bottom of the candlestick and the long black wick is found at the top ?
All bearish pin bars you’ll see form in the market will follow this basic structure. They’ll all have their body at the bottom candlestick and their wick at the top. Sometimes the body of the candle will not be found right at the bottom, like you see in the image above, but it will always be found in the bottom half of the candlestick.
image of bearish pin bar 2
Here’s another bearish pin bar.
With this pin, you can see the body of the candle is not found right at the bottom like we saw in the previous image but is instead located a little bit higher. Also the body of the pin bar itself is a bit smaller than what we saw on the bearish pin bar in previous image. The fact it leaves a small wick, and is smaller overall in terms of it’s size, doesn’t mean this bearish pin bar should be viewed or traded differently to any other bearish pin bars you see form in the market. So long as the body of the pin bar is found at the bottom half of the Candlestick and the majority of the wick is found at the top, the candle is considered to be a bearish pin bar.
image of bullish pin barHere we have an image of a bullish pin bar.
As you can see, bullish pin bars look very similar to bearish pin bars, the only real difference between the two is the body of the bullish pin bar is found at the top of the candle instead of the bottom, and most of the wick is found at the bottom instead of the top. Similar to the previous image the body of this bullish pin bar does not manage to close right at the top of the candle, but like I said before this doesn’t make a difference, it’s still a bullish pin bar and should be treated the same as all other bullish pin bars you see form in the market.
How To Make Sure It’s A Pin Bar Simply knowing the body of the candlestick needs to close towards the bottom or top of the candle for it be a bullish or bearish pin bar is a bit of vague advice, especially for newer traders who have little experience identifying pin bars in the market. To make it easier for the inexperienced traders to identify pin bars, I’ve come up with a little method you can use to confirm the candlestick you’re planning to trade is definitely a pin bar, and not another candlestick like an indecision candle. #Forex Candlestick Patterns
image of bearish pin bar 3Here’s an image I drew of a bullish pin bar.
You can see I’ve marked the high of the pin bar and the low of the pin bar with arrows.
If you were unsure weather the body of this candlestick was close enough to the bottom of the candle for it to be a bullish pin bar, the first thing you’d need to do is find out what the range of whole candlestick is. In order to find out the range, all you do is measure how far away from the low the high of the candlestick is. For the sake of the example lets just say the range of the candle in the image above is 200 pips.
Note:
To actually measure how far away the low of the candle is from the high, you need to select the crosshair tool in MT4 and click and drag the crosshair up from the low of the candle to the high. The distance will then be displayed as a three or four digit number next to the crosshair.
So now you know what the range of the candlestick is, the next thing to do is find out what a quarter of the range is. A quarter is found by halving the size of the range twice. In this example the range of the candle is 200 pips, so a quarter of that would be 50 pips. Once you’ve found what a quarter of the range is you then need to measure how far into the candle that is from the low or the high, as that will be our guideline for finding out if the candle we’re viewing is actually pin bar.
image of bearish pin bar with high and low marked Here’s an example to show you what I mean.
In the image above you can see I’ve marked two red lines. These two red lines show how far away 50 pips from the low and 50 pips from the high of the candle is.
The bottom red line is 50 pips away from the low of the candle and the top red line is 50 pips away from the high. If the body of this Candlestick was found within the area between the low and the point where I’ve marked 50 pips away from the low, the candle would be confirmed as a being a bearish pin bar.
If it was found in between the high and 50 pips away from the high, it would be a bullish pin bar.If you had a situation where the body of the candle was not found in the area in between the low or high, and was instead found on the point where I’ve marked 50 pips away from the low / away from the high, so long as the majority of the candlestick body is found to be in the area in between the low and the point marked as 50 pips away from the low the candlestick is a bearish pin bar. Conversely, if the majority of the candle body is over the red line marked as 50 pips away from the high but still in the area between the high and the point marked as 50 pips away the candle is still a bullish pin bar.
image of indescion candlestick
Now if the candlestick body is found to be in the space between the point where I’ve marked 50 pips from the high and the point where I’ve marked 50 pips from the low like you see in the image above, the candlestick is considered to be an indecision candle and should not be traded.
Summary Well I hope this guide has given you decent understanding of how to identify the pin bars you see form in the market. Like I said at the beginning, this article was meant primarily for the new traders who are just getting started in the forex market and have little to no knowledge of what pin bars are or how to trade them. If you really want to get good at trading pin bars I encourage you to read some the other pin bar articles I have on my site. I’ve left a list of the all articles below so feel free to check them out whenever you get chance.Forex Candlestick Patterns
Thanks for reading, if you have any questions please leave them in the comments section below.
Three black crows are a visual pattern, meaning that there are no particular calculations to worry about when identifying this indicator. The three black crows pattern occurs when bears overtake the bulls during three consecutive trading sessions. Forex Candlestick Patterns
How do you trade 3 black crows?-Forex Candlestick Patterns
First, there should be a prevailing uptrend in progress. Second, there must be three long and bearish (i.e., black or red) candlesticks in a row. Third, each of those candles must open below the previous day’s open. Ideally, it will open in the middle price range of the previous day.
threeBlackCrows
The Three Black Crows pattern is the opposite of the Three Advancing White Soldiers pattern. The Three Black Crows pattern is a bearish reversal pattern that consists of three bearish candlesticks that are ominous and dark in color, hence the name. This is a moderate trend reversal pattern that should only come into consideration when it appears in a rally or an established uptrend. The Three Black Crows usually indicates a weakness in an established uptrend and the potential emergence of a down trend. Forex Candlestick Patterns
Each of the three candlesticks in the Three Black Crows pattern should be relatively long bearish candlesticks with each candlestick closing at or near the low price for the period. Each successive candlestick should mark a steady decline in price and should not have long lower shadows or wicks. Preferably, each of the three candlesticks should open within the real body of the preceding candlestick in the pattern but this is not essential. When this pattern appears in an uptrend, it indicates the potential weakening of the trend and a possible trend reversal. However, if the three candlesticks are over extended and make significant price declines, you may need to be wary of oversold conditions. Forex Candlestick Patterns
Meaning
So what does all this mean? After a period of power, the bulls’ strength has waned and the bears are pushing the price downward. For three successful days, they march down those steps, creating a firm reversal. The continual downward movement signifies the vigor of the bears. The negative market sentiment is pushing the price downward, and this strong reversal (shifting from a bull market to a bear market) confirms that the upward price movement has ended. The Three Black Crows pattern is most useful for long-term traders. Forex Candlestick Patterns
To better understand the Three Black Crows you’ve spotted, keep an eye on the candles’ lengths. The second and third candles must be approximately the same size, to show that the bears are firmly in control. If the third candle is clearly smaller than the others, this indicates weakness and the pattern is not as reliable as it might have been otherwise. Forex Candlestick Patterns
Formation
As we mentioned above, the Three Black Crows form a sort of staircase that leads downward, forming over three trading sessions. If you think you’ve spotted this candlestick pattern, look for the following criteria:
First, there should be a prevailing uptrend in progress. Second, there must be three long and bearish (i.e., black or red) candlesticks in a row. Third, each of those candles must open below the previous day’s open. Ideally, it will open in the middle price range of the previous day. Fourth, each candle must close progressively downward, establishing a new short-term low. Fifth and finally, it is important that the candles have very small (or nonexistent) lower wicks.
If you’ve spotted what appears to be the opposite of the Three Black Crows (three long-bodied, white candles that are moving progressively upward), you probably have Three White Soldiers on your hands. This signal indicates a reversal from a bear market to a bull market.
Forex Trading Strategy
Chart Example
The Three Black Crows can be seen in the shaded area on the following 15-minute Euro/USD Forex chart. The Three Blck Crowswere made from a double tops level at around 1.30249 that was made at 2:15 AM and at 11:00 AM on May 14, 2013. Forex Candlestick Patterns
The Three Blck CrowsForex Candlestick PatternsForex Candlestick Patterns
Here, we can see that the price is above the broken trendline.now we have to wait until the price is above the daily support level.then we can make a buy order.
GBPUSD has retraced from a daily resistance level and broke a trendline in H1. now we are waiting for a breakout of the support level (1.25804). after breakout we can go for short.
The EURJPY was down a lot yesterday and closed below the support level in daily timeframe.now we are waiting for a retracement from daily pivot or from the grey horizontal line. wait for a candle pattern and then we can take entry.